Simplify Langfuse for Scale
Langfuse now delivers faster product performance at scale. See the v4 overview for rollout details, access, and migration steps.
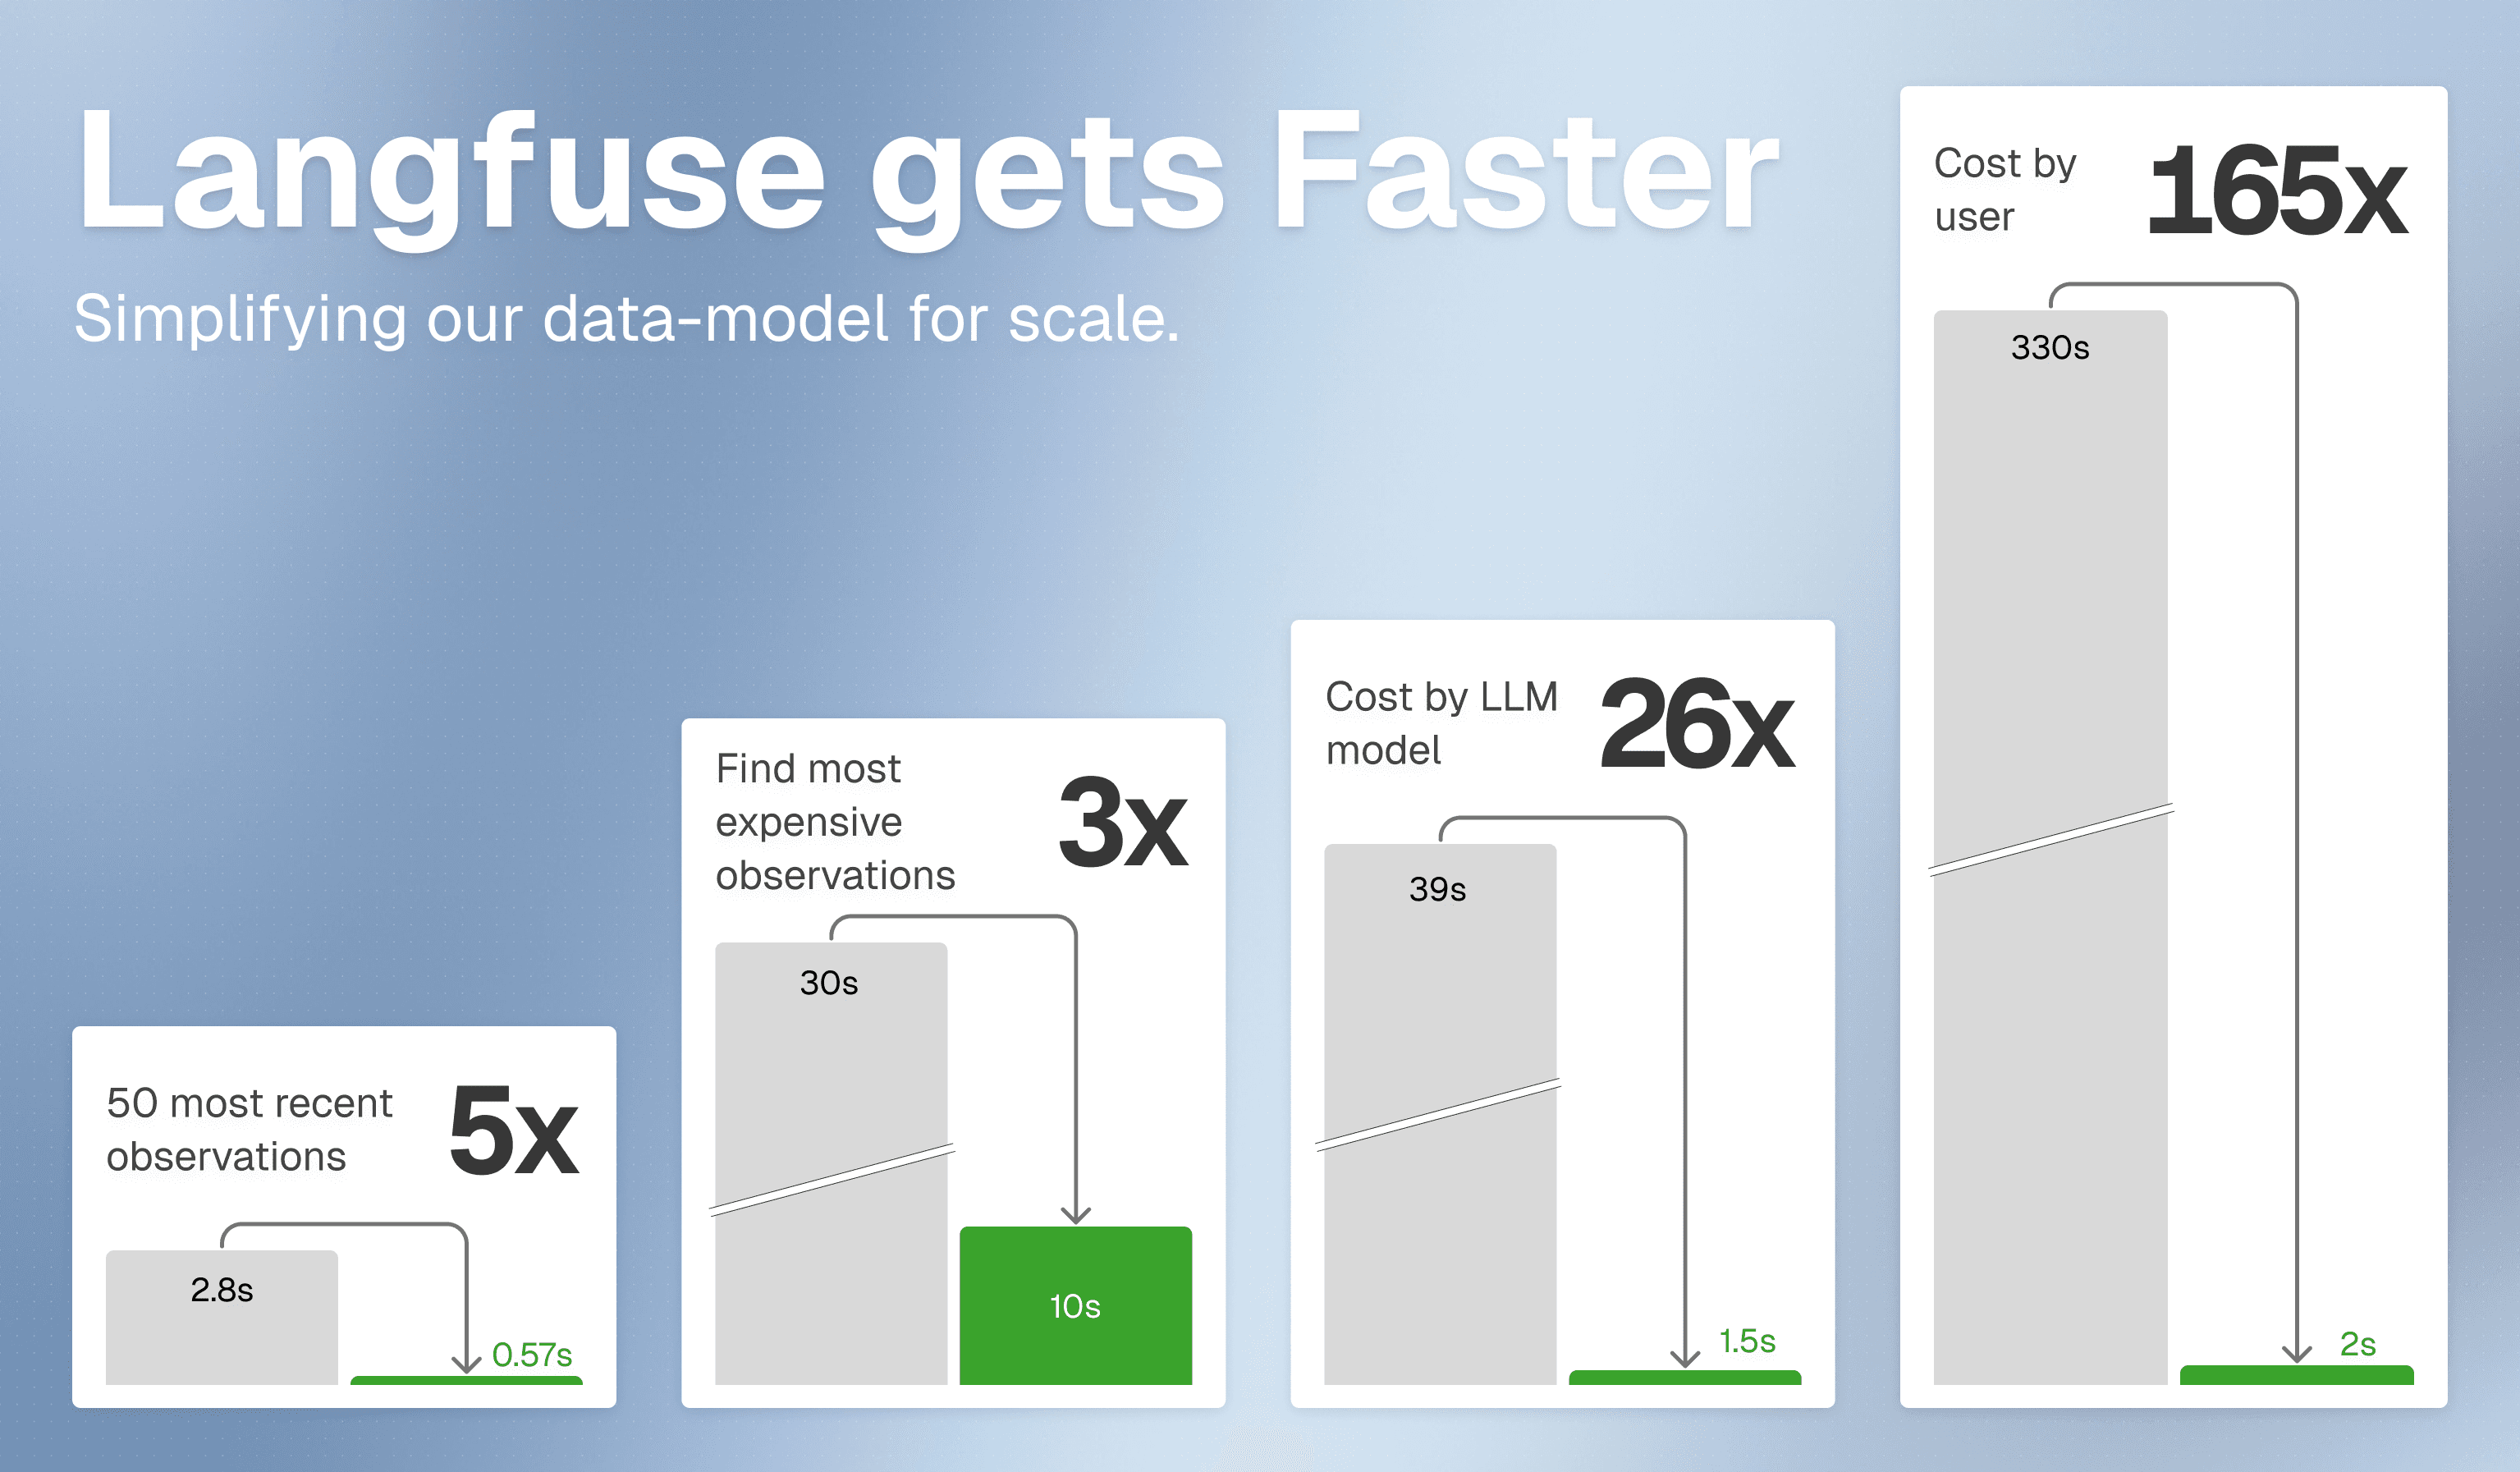
Charts, filters, and APIs across Langfuse Cloud are now significantly faster — and you get a more powerful way to explore your data: a single observations table where every LLM call, tool execution, and agent step is directly queryable.
To avoid delays in the new experience and see your data in real time, upgrade to Python SDK v4 and JS/TS SDK v5.
What changes for you
The main table in Langfuse is now observations. Traces are no longer a separate table — instead, trace_id is a filter column you can use to group observations belonging to the same trace, just like session_id or user_id. This means you can now query across all operations directly: find every expensive LLM call, every failed tool invocation, or every slow retrieval — without opening individual traces first.
If you want the familiar one-row-per-trace view, filter for root observations and save it as a saved view. See the guide on working with observations in v4 for more before/after workflows.
What's faster now
Faster product performance in the UI
Chart loading time is significantly shorter. You can now confidently load charts over large time ranges. Browsing traces, users, and sessions is also much faster, and filters respond more quickly in large projects.
Faster API workflows
The new Observations API v2 and Metrics API v2 are designed for faster querying and aggregations at scale.
Faster evaluation workflows
Observation-level evaluations execute in seconds as we do not need to query ClickHouse for each evaluation anymore.
Working with the new observations table
In v4, Langfuse uses a single unified observations table as the main exploration surface. All inputs, outputs, and context attributes live directly on observations, enabling faster filtering and aggregation at scale. This approach aligns with where the observability community is heading — what is broadly described as Observability 2.0 and Wide Events: a flat, filterable table of richly attributed observations is more powerful than a grouped traces view, especially as agentic applications produce thousands of operations per trace.
You will notice more rows than before — that's expected. Each row is now one operation, not one trace. Use filters and saved views to focus on what matters. Most users start with one of these common views:
| View | How to set it up |
|---|---|
| All traces (like the old table) | Filter for root observations (no parent observation), save as a view |
| Expensive LLM calls | Filter type = generation, sort by total_cost descending |
| Errors for a specific user | Filter user_id, level = ERROR |
| Slow observations in a session | Filter session_id, sort by latency descending |
See the full guide on working with the observation-centric data model in v4 for detailed before/after workflows, saved view setup, and upgrade steps.
Learn more
Check out our technical blog post on the new data model.